Workflow
The graph of the applied factory, drawn from its files.
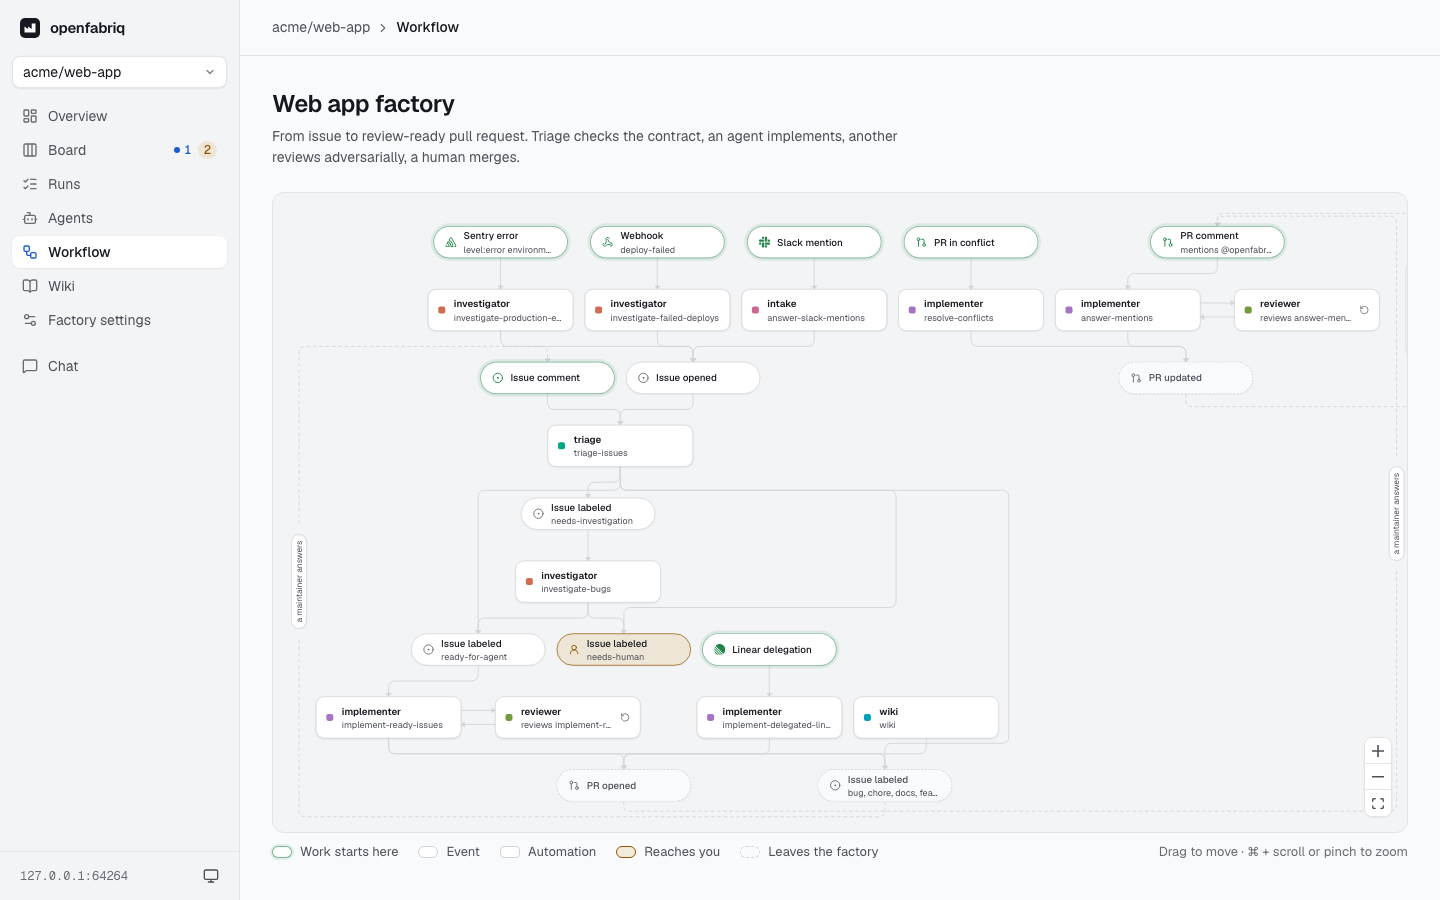
The workflow page draws the applied factory as a graph. Read it after each apply to check that every step leads somewhere.
Reading the graph
Each event points to the automation it starts. Each automation points to the events its rights produce, such as a label added, a pull request opened or a change request. Feedback loops appear as loops, for example a maintainer answers on a triage that asks questions. An automation with reviewed_by has its reviewer beside it, in a loop: the change goes to the reviewer, and needs changes comes back, before anything leaves the machine.
The graph shows where work enters the factory (a person, GitHub, a schedule, Slack, Linear, Sentry or a webhook) and where it leaves: needs-human, needs-info, or a merged pull request. Nodes in a person's colors mark where someone has to act.
Click a node to open its panel beside the graph. For an automation: what starts it, what it may write on GitHub, and what can come next. For an event: who makes it happen and which automation picks it up. With nothing selected, the panel sums up where work starts, the automations, and what reaches you.
Seen from an area
When the factory orders its agents by area, a row of links above the graph shows it from one area:
- its automations stay, with the events they listen to and produce;
- the automations of other folders that produce what it listens to, or listen to what it produces, stay faded, with their area's name: the work comes from them or goes on there;
- the rest hides, including automations that only share its events.
The area is in the page's address (?area=qa), so you can share that view. All shows the whole graph again.
What to look for
- A step that leads nowhere.
- A label that no automation listens to.